
Panic analysisPro
Crash analysis: is it the app or the iPhone?
Not every problem ends in a panic. Apps that close by themselves, a phone that feels unstable or apps that quit when the phone is warm leave crash reports instead. BenchDock reads them and answers the question a customer asks first: is it this one app, or is something wrong with the phone? Crash analysis is part of Pro.
Analyse a device or report files
- Click Crash analysis in the sidebar.
- With a phone connected and ready, click Analyse (followed by the name of the phone). BenchDock reads up to 500 of the most recent crash reports on the device.
- Or click Open report files… and choose
.ipsor.crashfiles that a customer sent you.
The conclusion
At the top, BenchDock gives one conclusion:
| Conclusion | Meaning and advice |
|---|---|
| Most likely an app problem | One app crashes repeatedly while the others are stable. Update or reinstall the app. |
| Memory pressure | iOS closed apps many times for lack of memory. Check free storage, restart the phone and update iOS. |
| Heat | iOS stopped apps because the phone was too hot. Check the charger, the case and the battery. |
| Device problem, not explained by one app | Many processes fail at once: memory access faults, crashing system processes, resets. Make a backup, restore iOS and check the panic logs. |
| No clear pattern | Reports without a repeating pattern. |
If the reports also contain kernel panics, the conclusion says so. Check those first in the panic analysis.
Numbers and timeline
Below the conclusion you see the number of reports and the period they cover, the app crashes and the number of processes involved, the memory reports (Jetsam) with how many were in the last seven days, and the kernel panics and reset reports.
Reports per day shows the reports as a bar per day, split into app crashes, memory, panics and other. A sudden rise from one day on often matches a change on that day, such as an iOS update or a new app.
Per app or process
The table lists every app or process that crashed, with the number of crashes, the most common exception, the app versions and the first and last date. Click a row for the details:
- A verdict for that app, for example mostly with the same exception: app problem.
- Signals such as Started after the update to iOS …, All crashes are on app version … or the app's certificate is no longer valid.
- What the exceptions mean, for example a memory access fault or a watchdog stop because the app did not start in time.
- The evidence lines from the reports themselves, with the date, the file, the app version and the iOS version.
Memory and system signals
Memory (Jetsam) explains why iOS closed apps: an app over its memory limit, a system-wide memory shortage, and more. It also names the largest processes at the moment of the report.
System signals counts the crashing iOS system processes, the processes with memory access faults in the last seven days, reset reports, hang reports and apps stopped for heat. When there are panics, Read the panic logs opens the crash logs in the Toolbox.
iOS versions in the reports shows which iOS versions the reports came from, with the period for each. That makes it easy to see whether the crashes began with an update.
Questions
What is the difference with the panic analysis?
A panic restarts the whole phone and usually points to hardware. A crash report is about one app or process. The panic analysis is free; crash analysis is part of Pro.
Does BenchDock delete the reports?
No. Crash analysis only reads. Deleting crash reports from the phone is a separate action in the Toolbox under crash logs, after you confirm.
Does BenchDock read every report?
It reads the newest 500 reports on the phone. When there are more, BenchDock shows how many of them were read.
Related guides
-
 Panic analysis
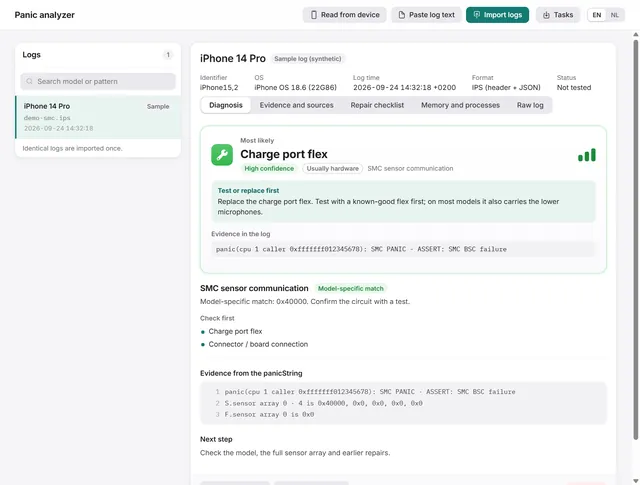
How to read an iPhone panic log and find the faulty part
Import, paste or read a panic log over USB. BenchDock names the part to test first, with the confidence and the evidence line. Free -
Panic analysis
How to get panic logs from an iPhone
Read panic logs over USB, find them under Analytics Data on the phone, or paste the text a customer sends you. Free -
 Workshop tools
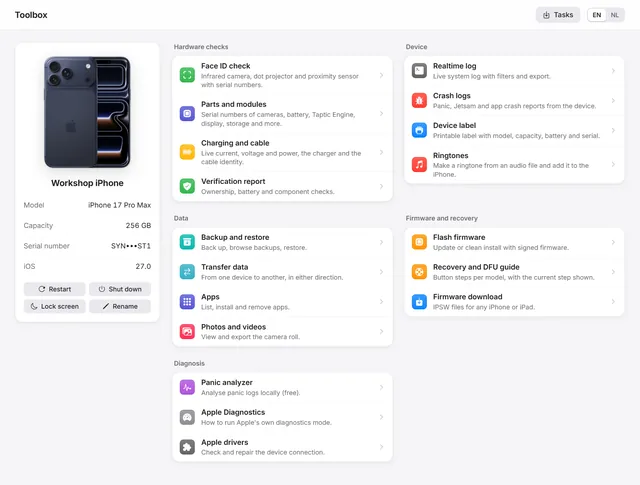
The Toolbox: parts, realtime log, crash logs and device label
Parts and serial numbers, the realtime log, crash logs, a printable device label, Apple Diagnostics and restart, shut down and rename. Free and Pro -
 Device
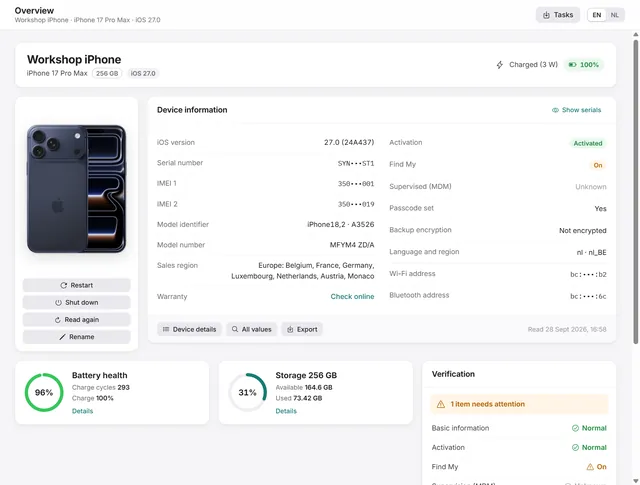
Device overview: serial number, IMEI, battery health and storage of an iPhone
Identity, activation, Find My, battery health, charge cycles and storage at a glance, with every value the phone returns. Free and Pro